Century 21 People’s Choice Realty Inc., Brokerage
120 MATHESON BLVD E #103
MISSISSAUGA, Ontario
L4Z 1X1


Welland, 767 - N. Welland, L3C 3K9
$699,000$000000
Listed by ROYAL LEPAGE NRC REALTY.
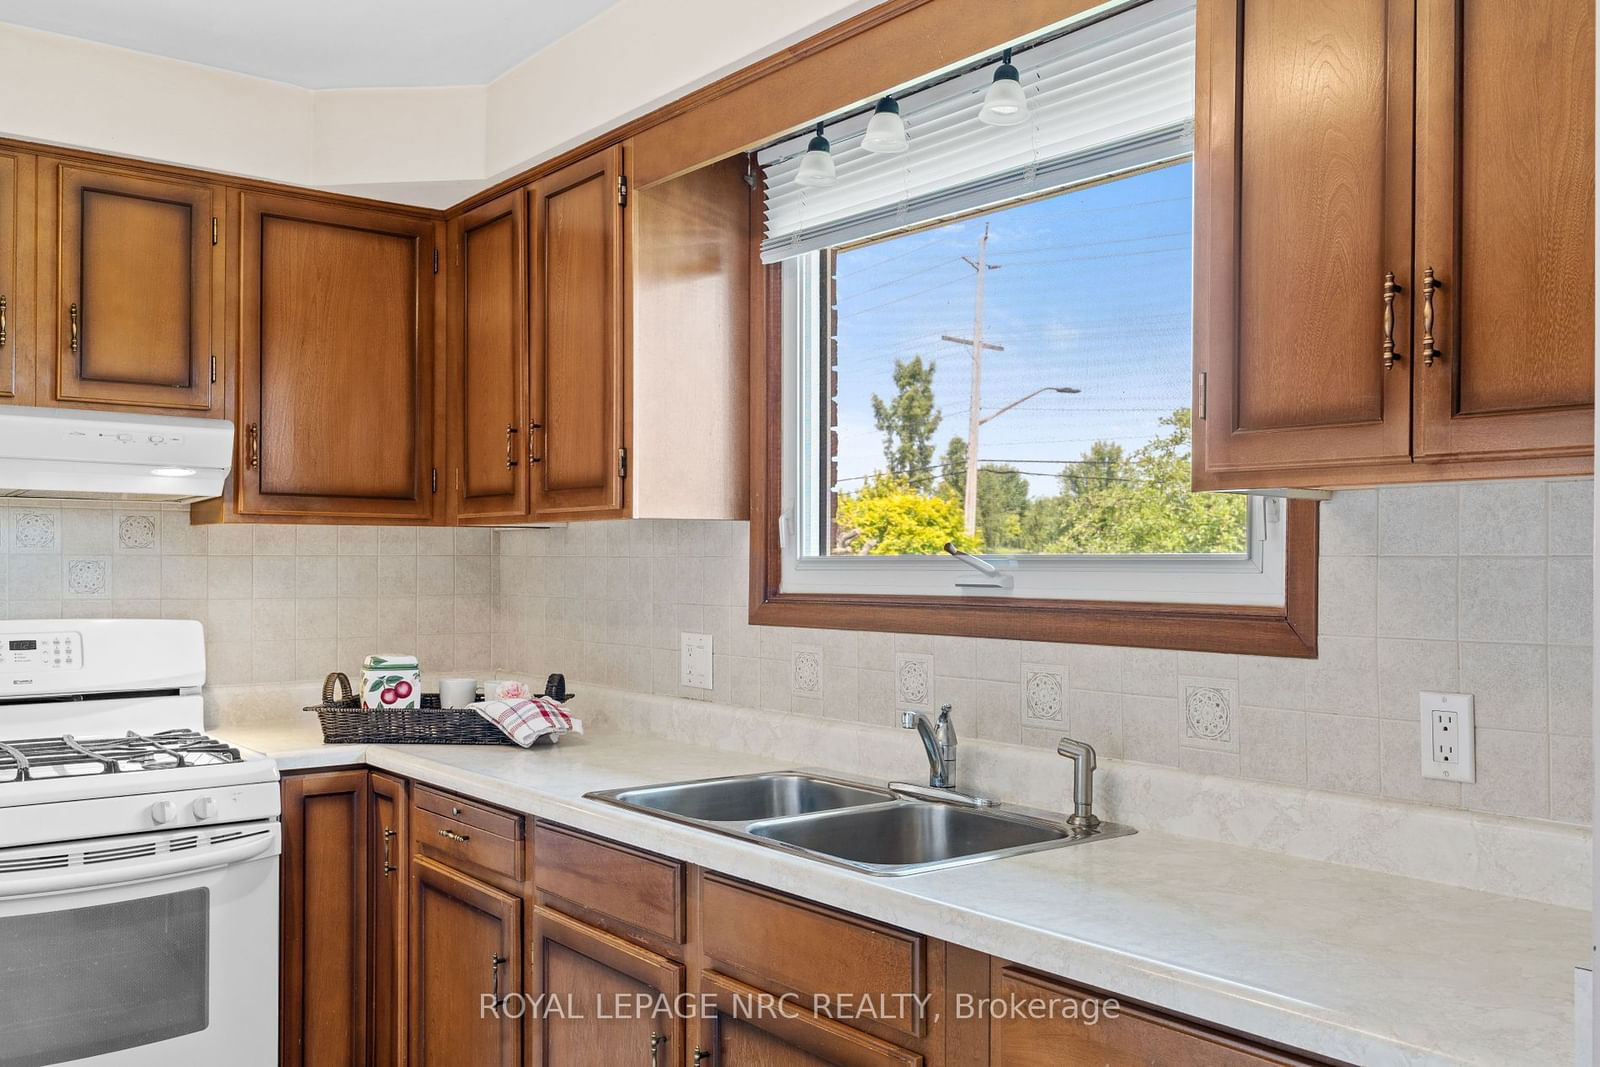
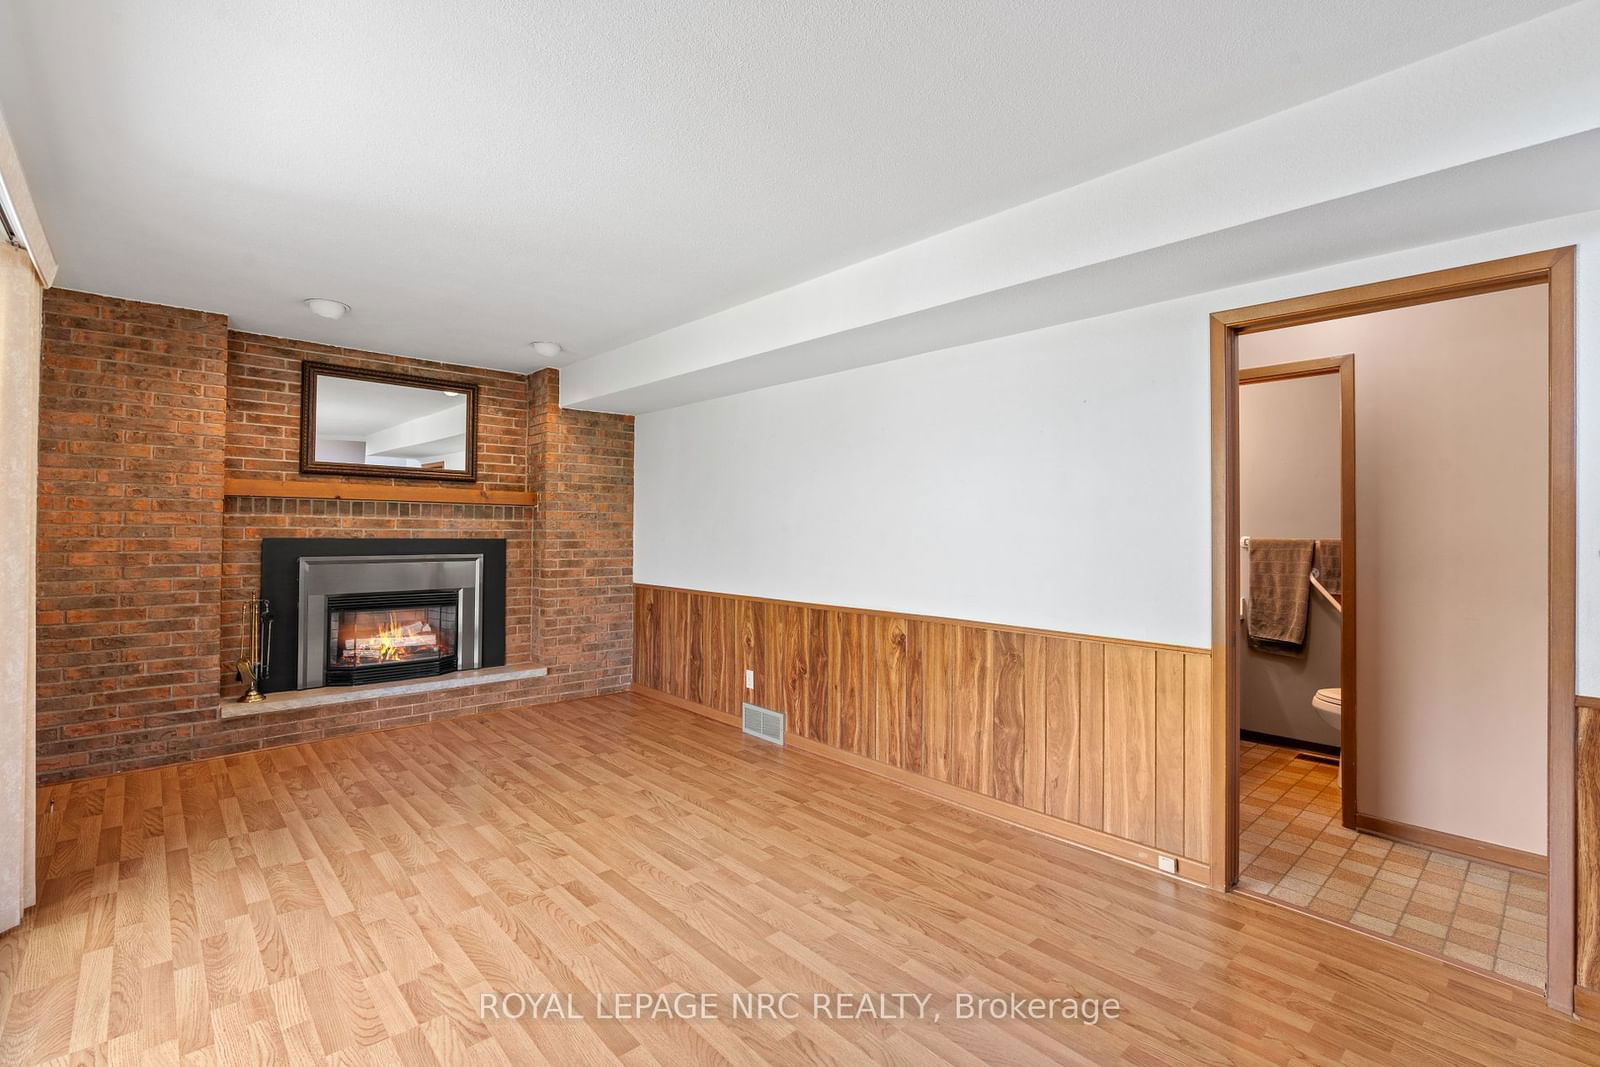
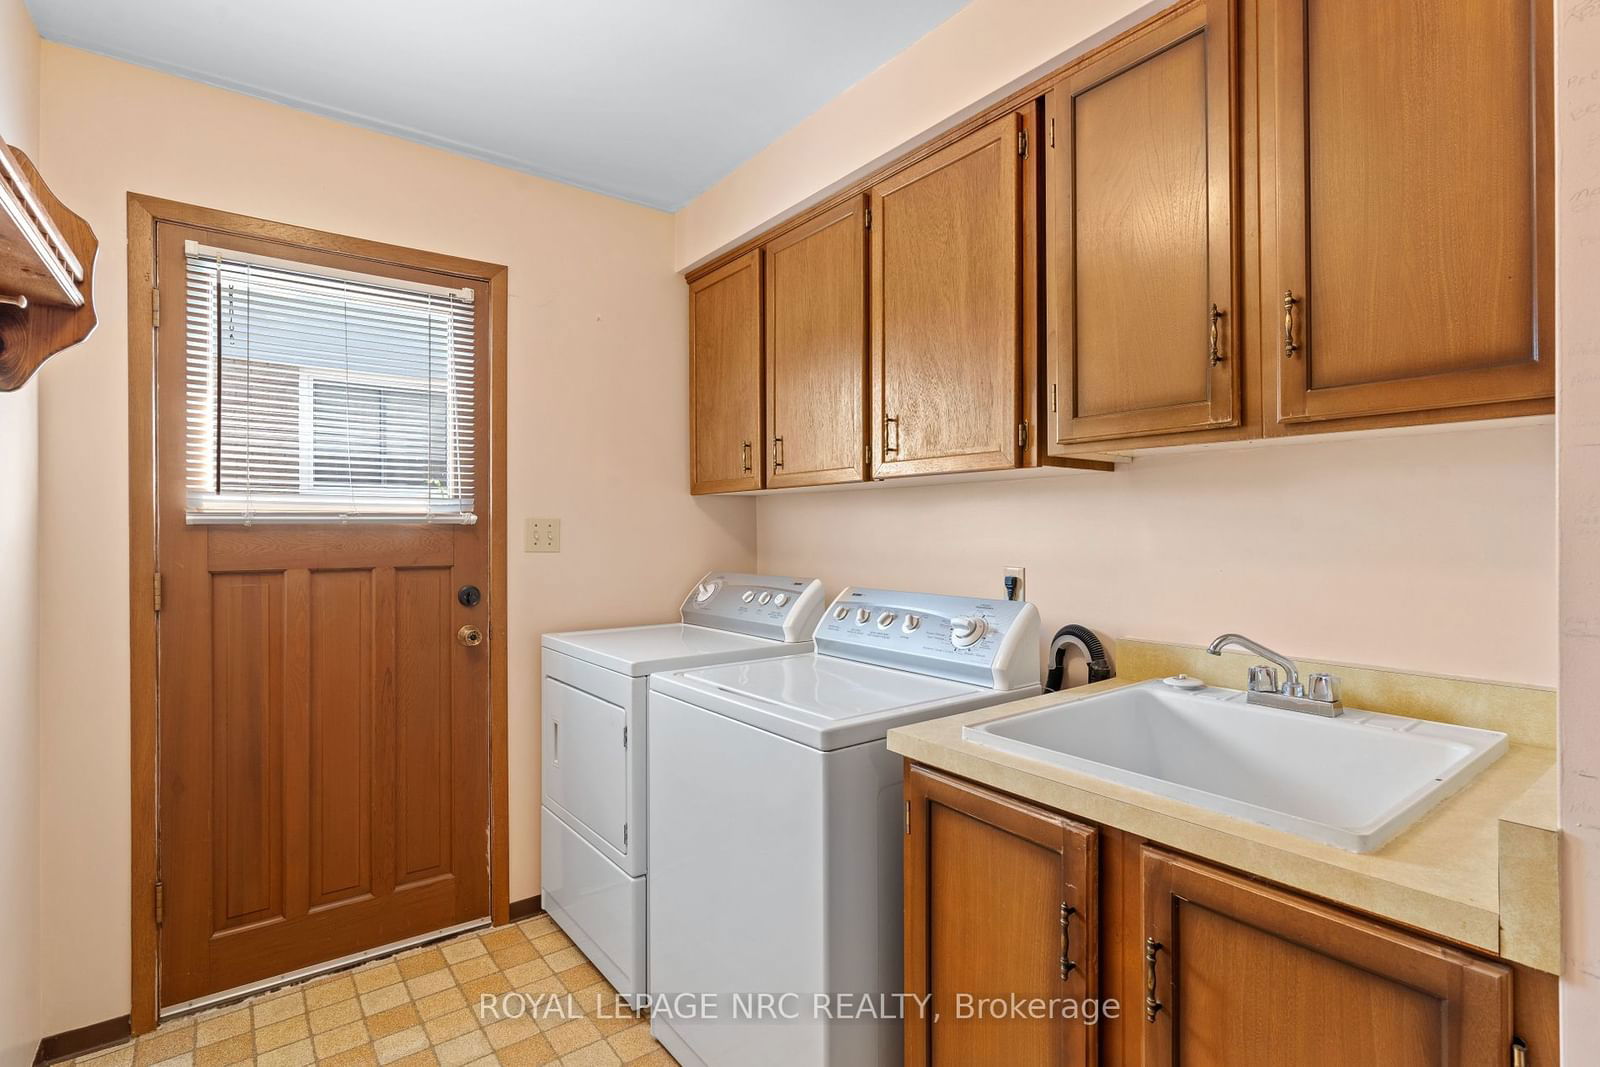
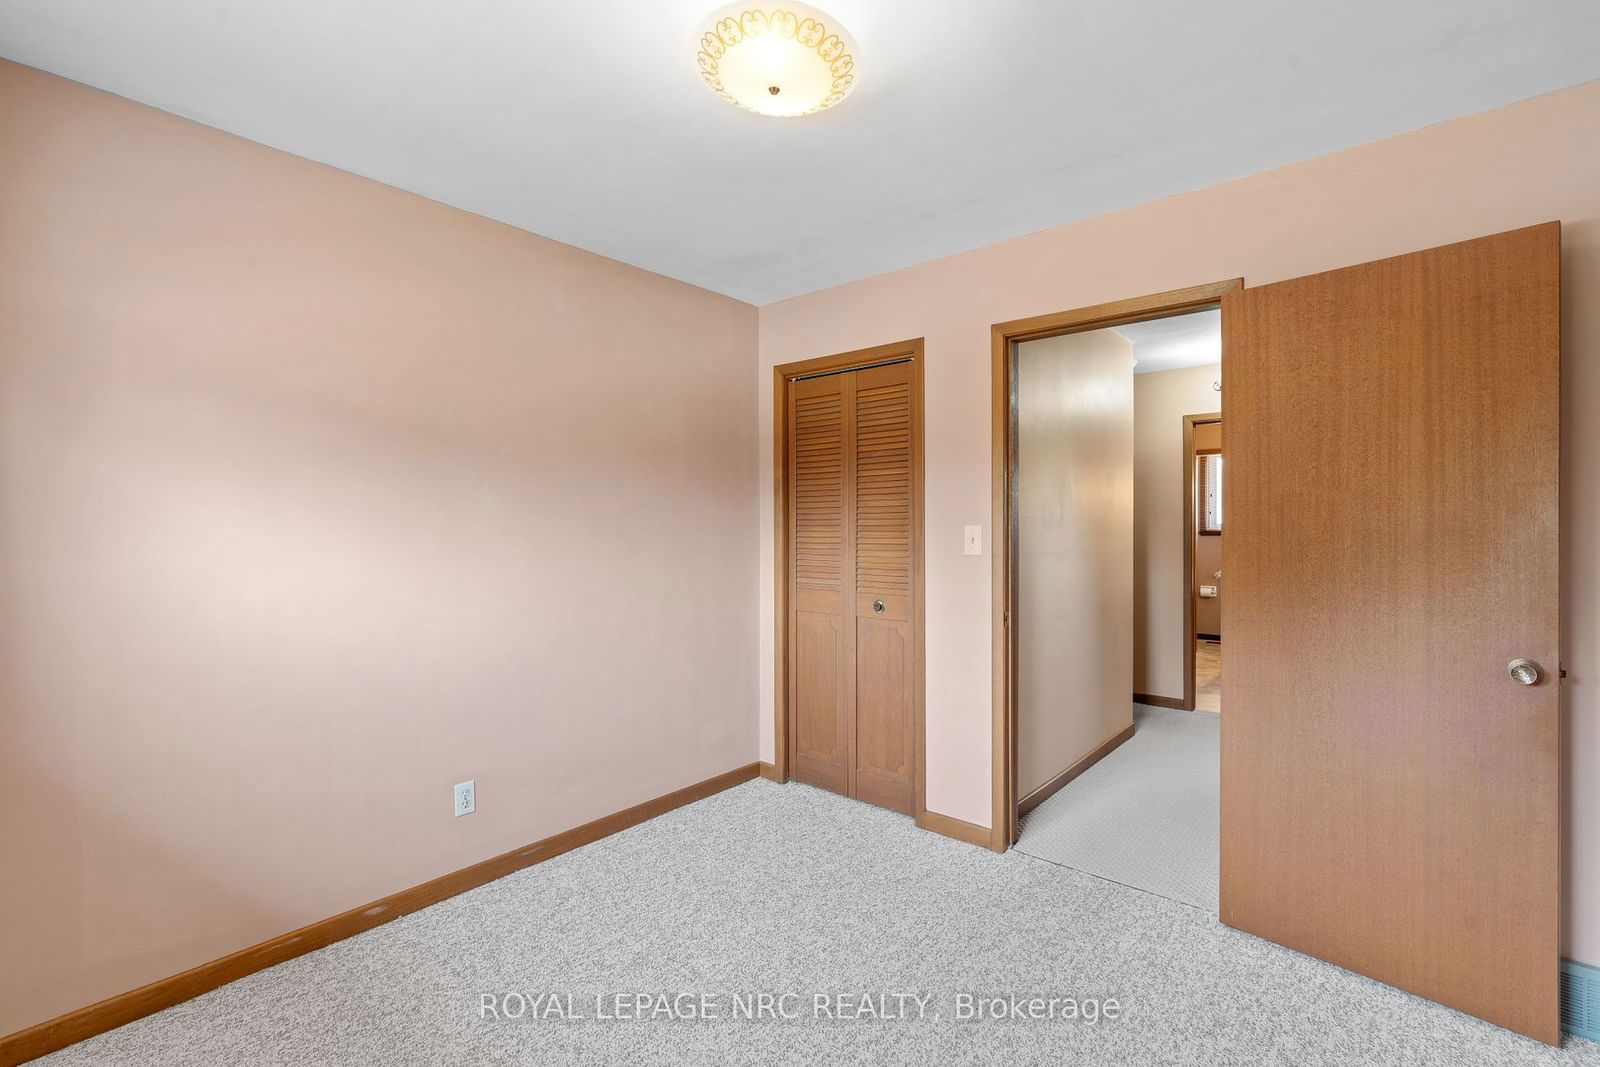
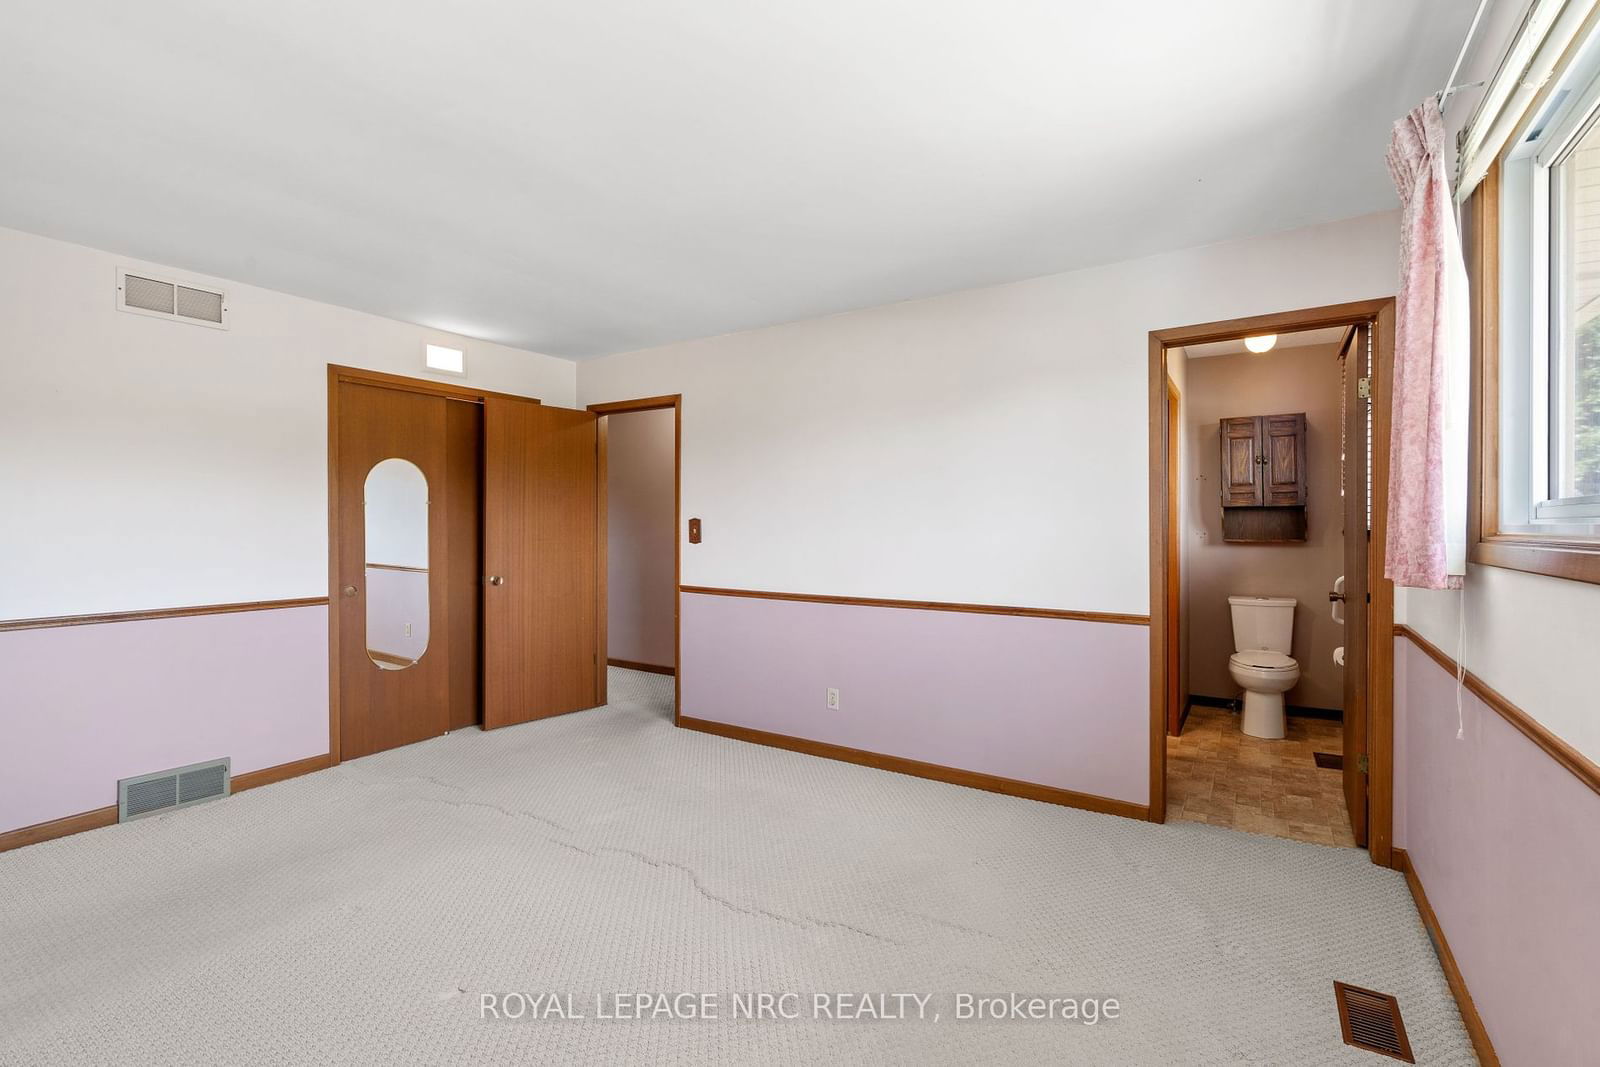
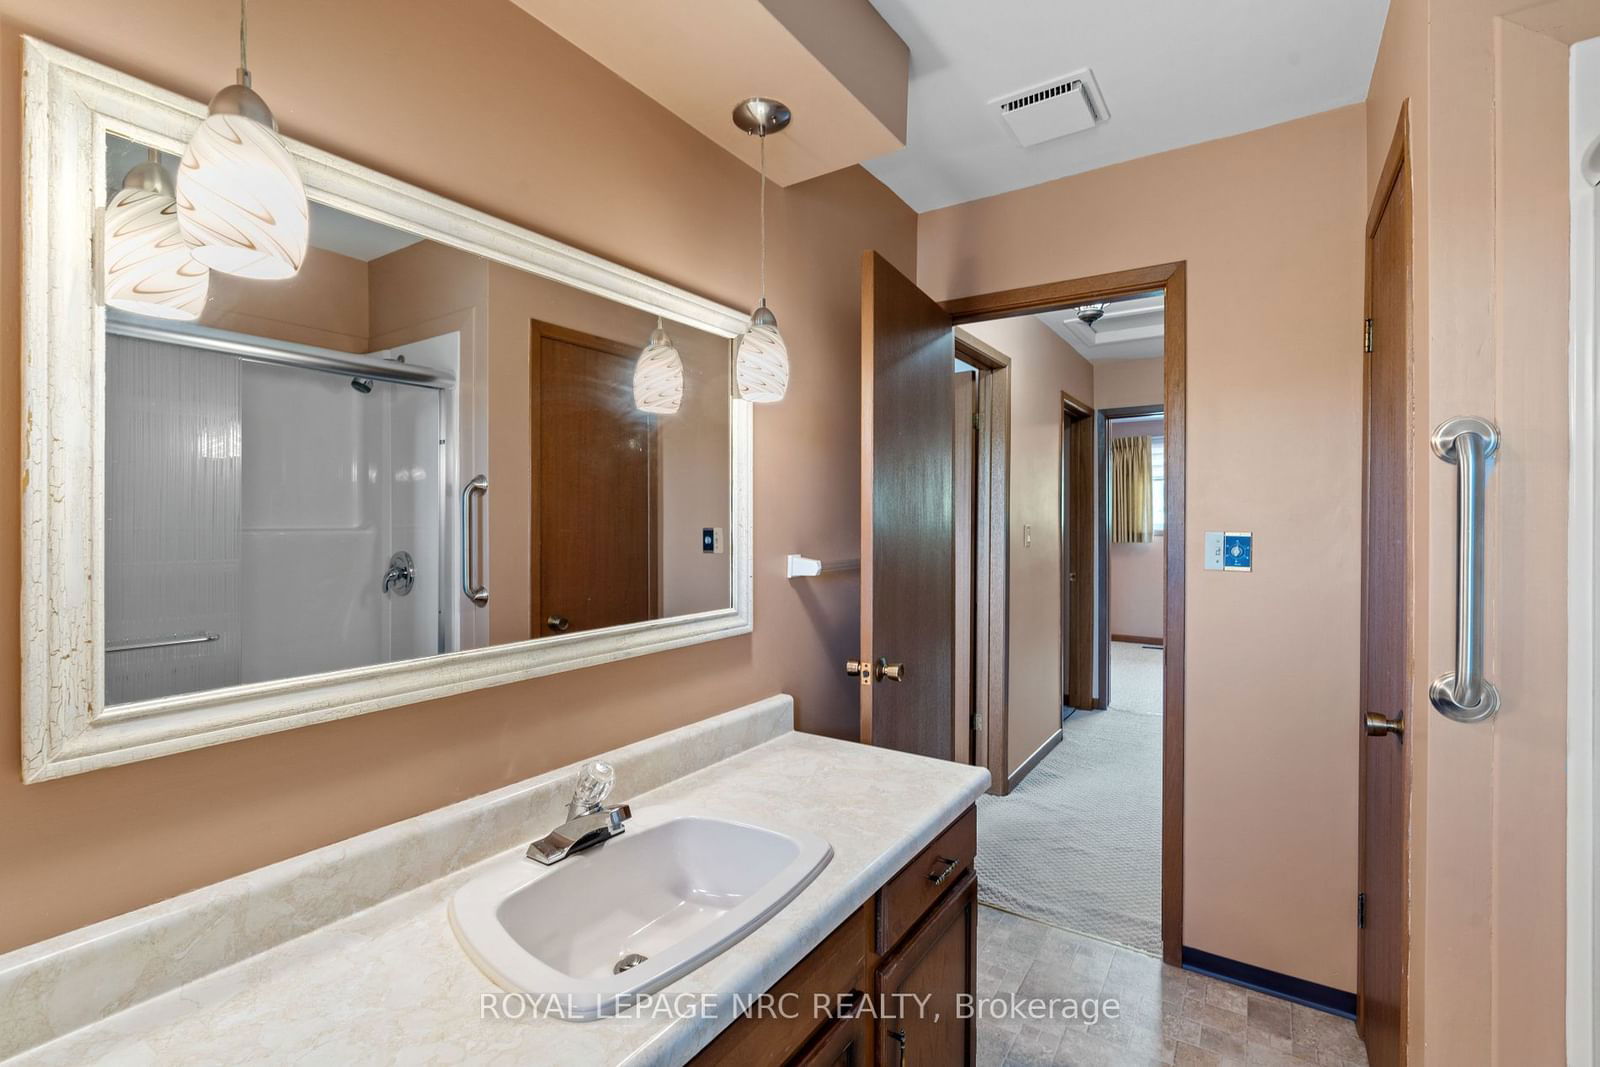
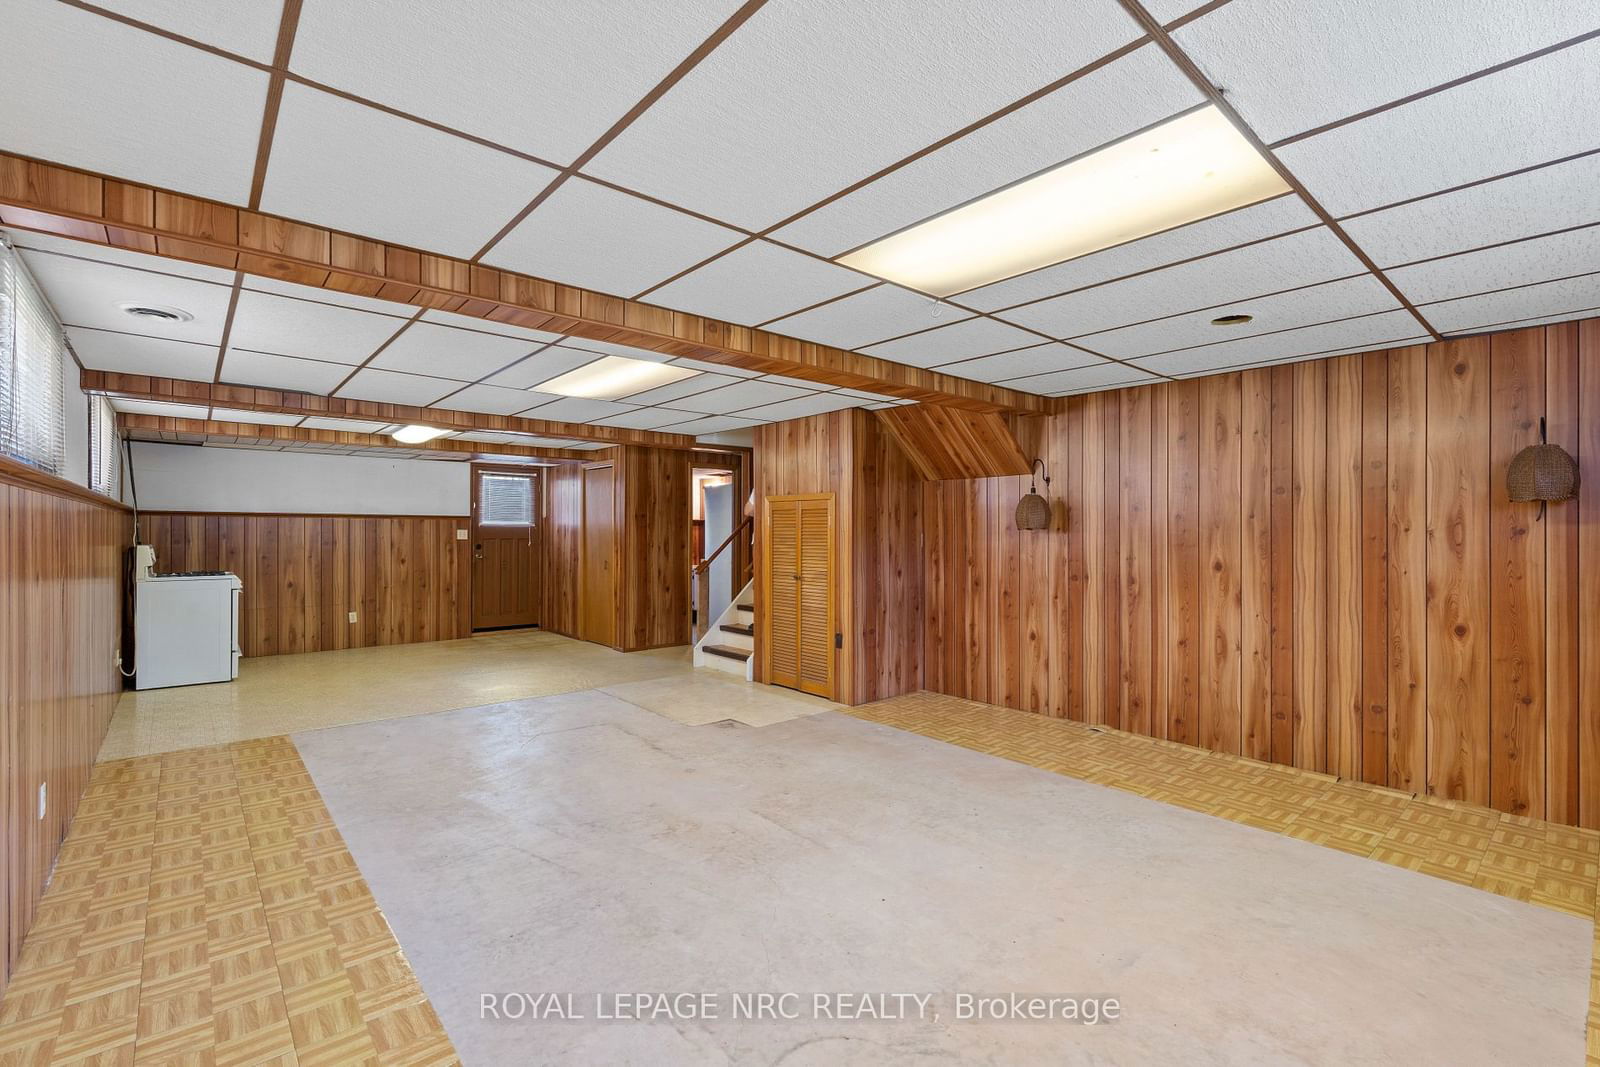
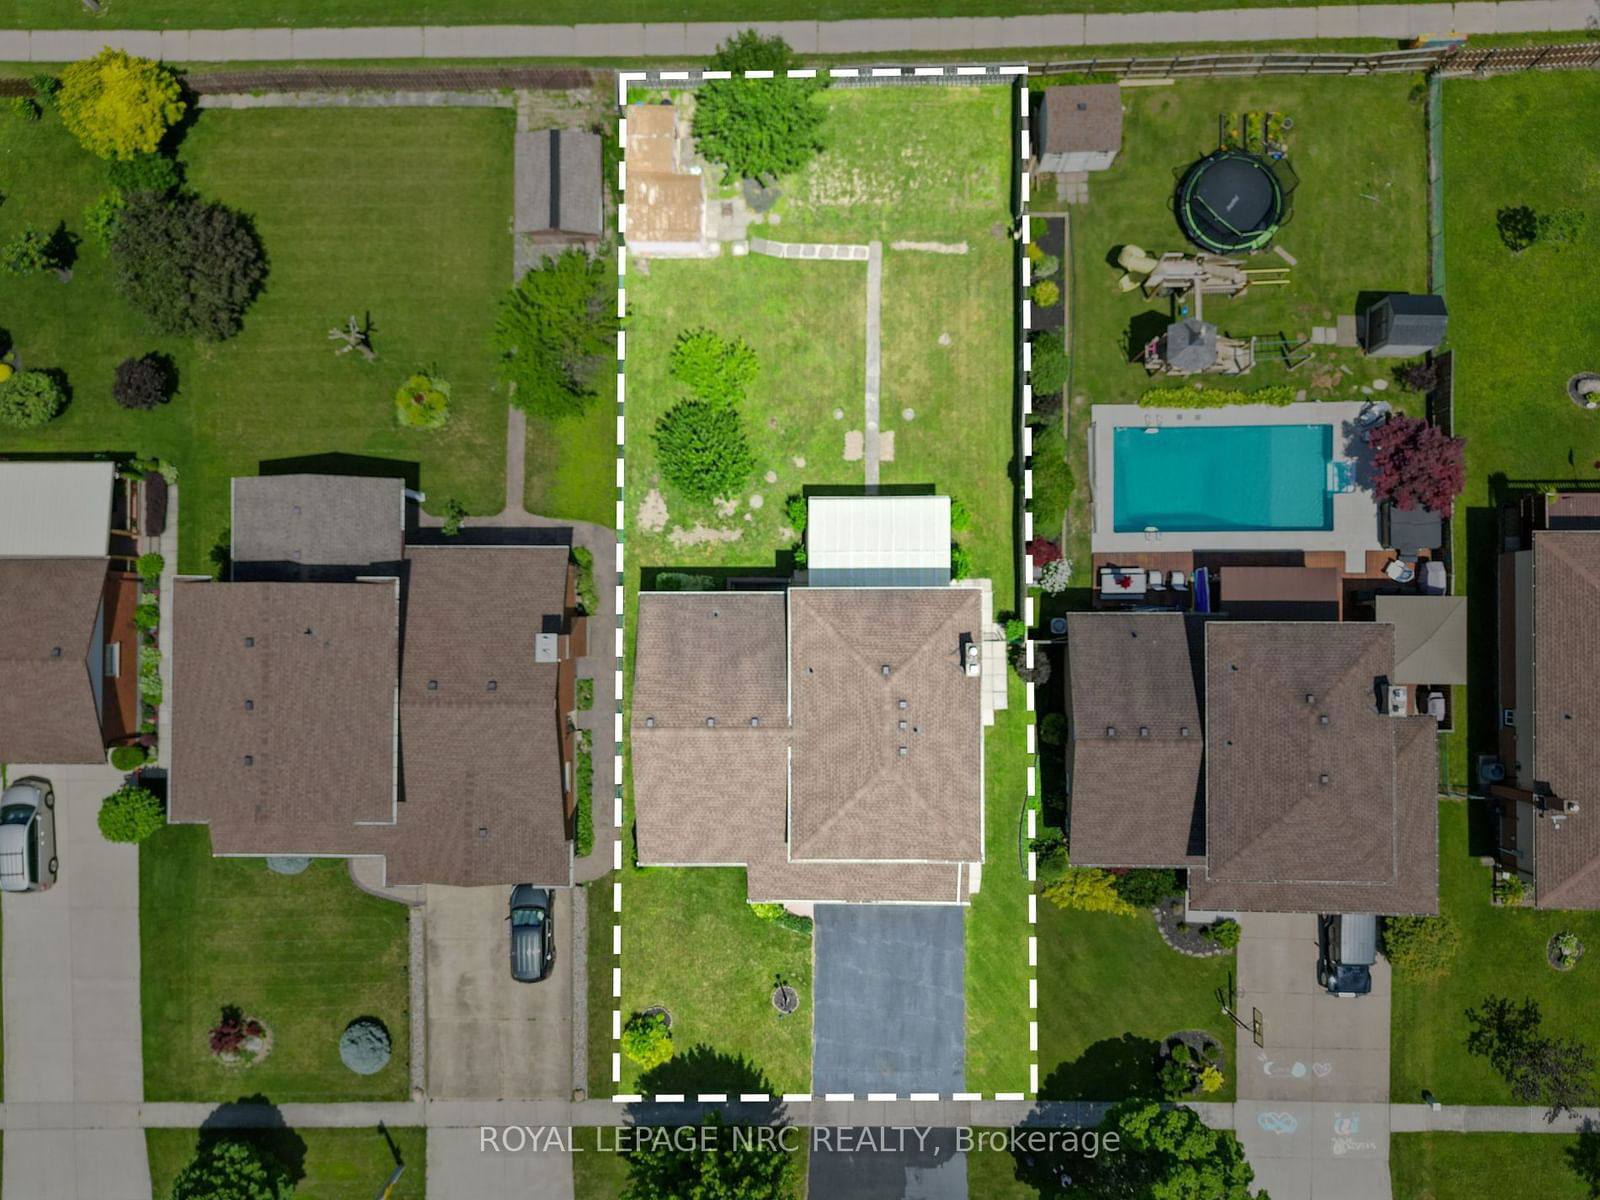
WELCOM TO WELLAND'S SHERWOOD FOREST NEIGHBOURHOOD - This PLUS-SIZED custom built original owner home boasts 1900 square feet of above ground living space. The UPPER FLOOR includes 3 bedrooms with the primary having ensuite privileges to the 3 piece bathroom. The main level features a formal living room, U-shaped kitchen with a bright and open dining area, dining room, family room with gas fireplace and walk out to the covered patio, full laundry room with walk out to the side yard, a 2 piece bathroom and inside access to the double garage. The diningroom is well suited as a den, home office or 4th bedroom. The 520 square foot LOWER LEVEL has IN-LAW SUITE or ACCESSORY DWELLING UNIIT potential to convert the current front to back recreation room with 3 piece bathroom & direct walk-up to the rear yard. Situated on a sprawling 0.21 acre lot and offering ample room for both relaxation and potential expansion. The unfinished basement level offers ample storage and home workshop area as well as a cold cellar for the city homesteader. Niagara College, YMCA/Daycare and surrounding amenities are within a short walking distance via a convenient rear gate to Woodlawn Road. This circa 1977 family home has been lovingly cared for by the same family since new. Value added updates include windows, roof shingles, R28 to R40 attic insulation, garage door as well as some newer flooring. The north end is the in-demand location, offering convenience to a variety of essential amenities, Seaway Mall, highways 406 & 20 for easy commuting to Fonthill/Pelham, St Catharines, Niagara Falls and beyond. This is the one for growing families looking to move up as interest rates begin to settle down.
Foyer
Living
Family
Kitchen
Dining
Laundry
Prim Bdrm
2nd Br
3rd Br
Rec
Utility
The graph below compares the average list price and average sale price of homes in this neighborhood by month for the last 24 months. When average sale price is greater than average list price, this may suggest a buyer's market. When average sale price is lower than the average list price this may suggest a seller's market.
The graph below illustrates the average days on market for homes in this neighborhood. The yellow area may indicate a buyer's market, the green area may indicate a balanced market and the red area may indicate a seller's market.
Sales Representative, Century 21 People’s Choice Realty Inc., Brokerage
(647) 576 - 2100